Transfer Scout: The Fee Against What Happened Next
A club pays €40m for a striker. Four years later he leaves for €12m, having scored 31 goals. Was that a good deal?
The awkward part is not the judgement. It is that the fee and the 31 goals live in two different tables that never meet, and joining them by hand — for one player, let alone ten seasons of five leagues — is an afternoon each time.
Transfer Scout is the tool I built so it stops being an afternoon.
One row per spell
The unit of analysis is a spell: one player at one club, from arrival to departure. Not a transfer, and not a season.
That choice does most of the work. A transfer alone tells you what was paid and nothing about what followed. A season splits a four-year spell into four rows and makes “did this signing work” unanswerable. A spell is the smallest unit where the question makes sense at all: money in, money out, and everything the player did on the pitch in between, all on one line.
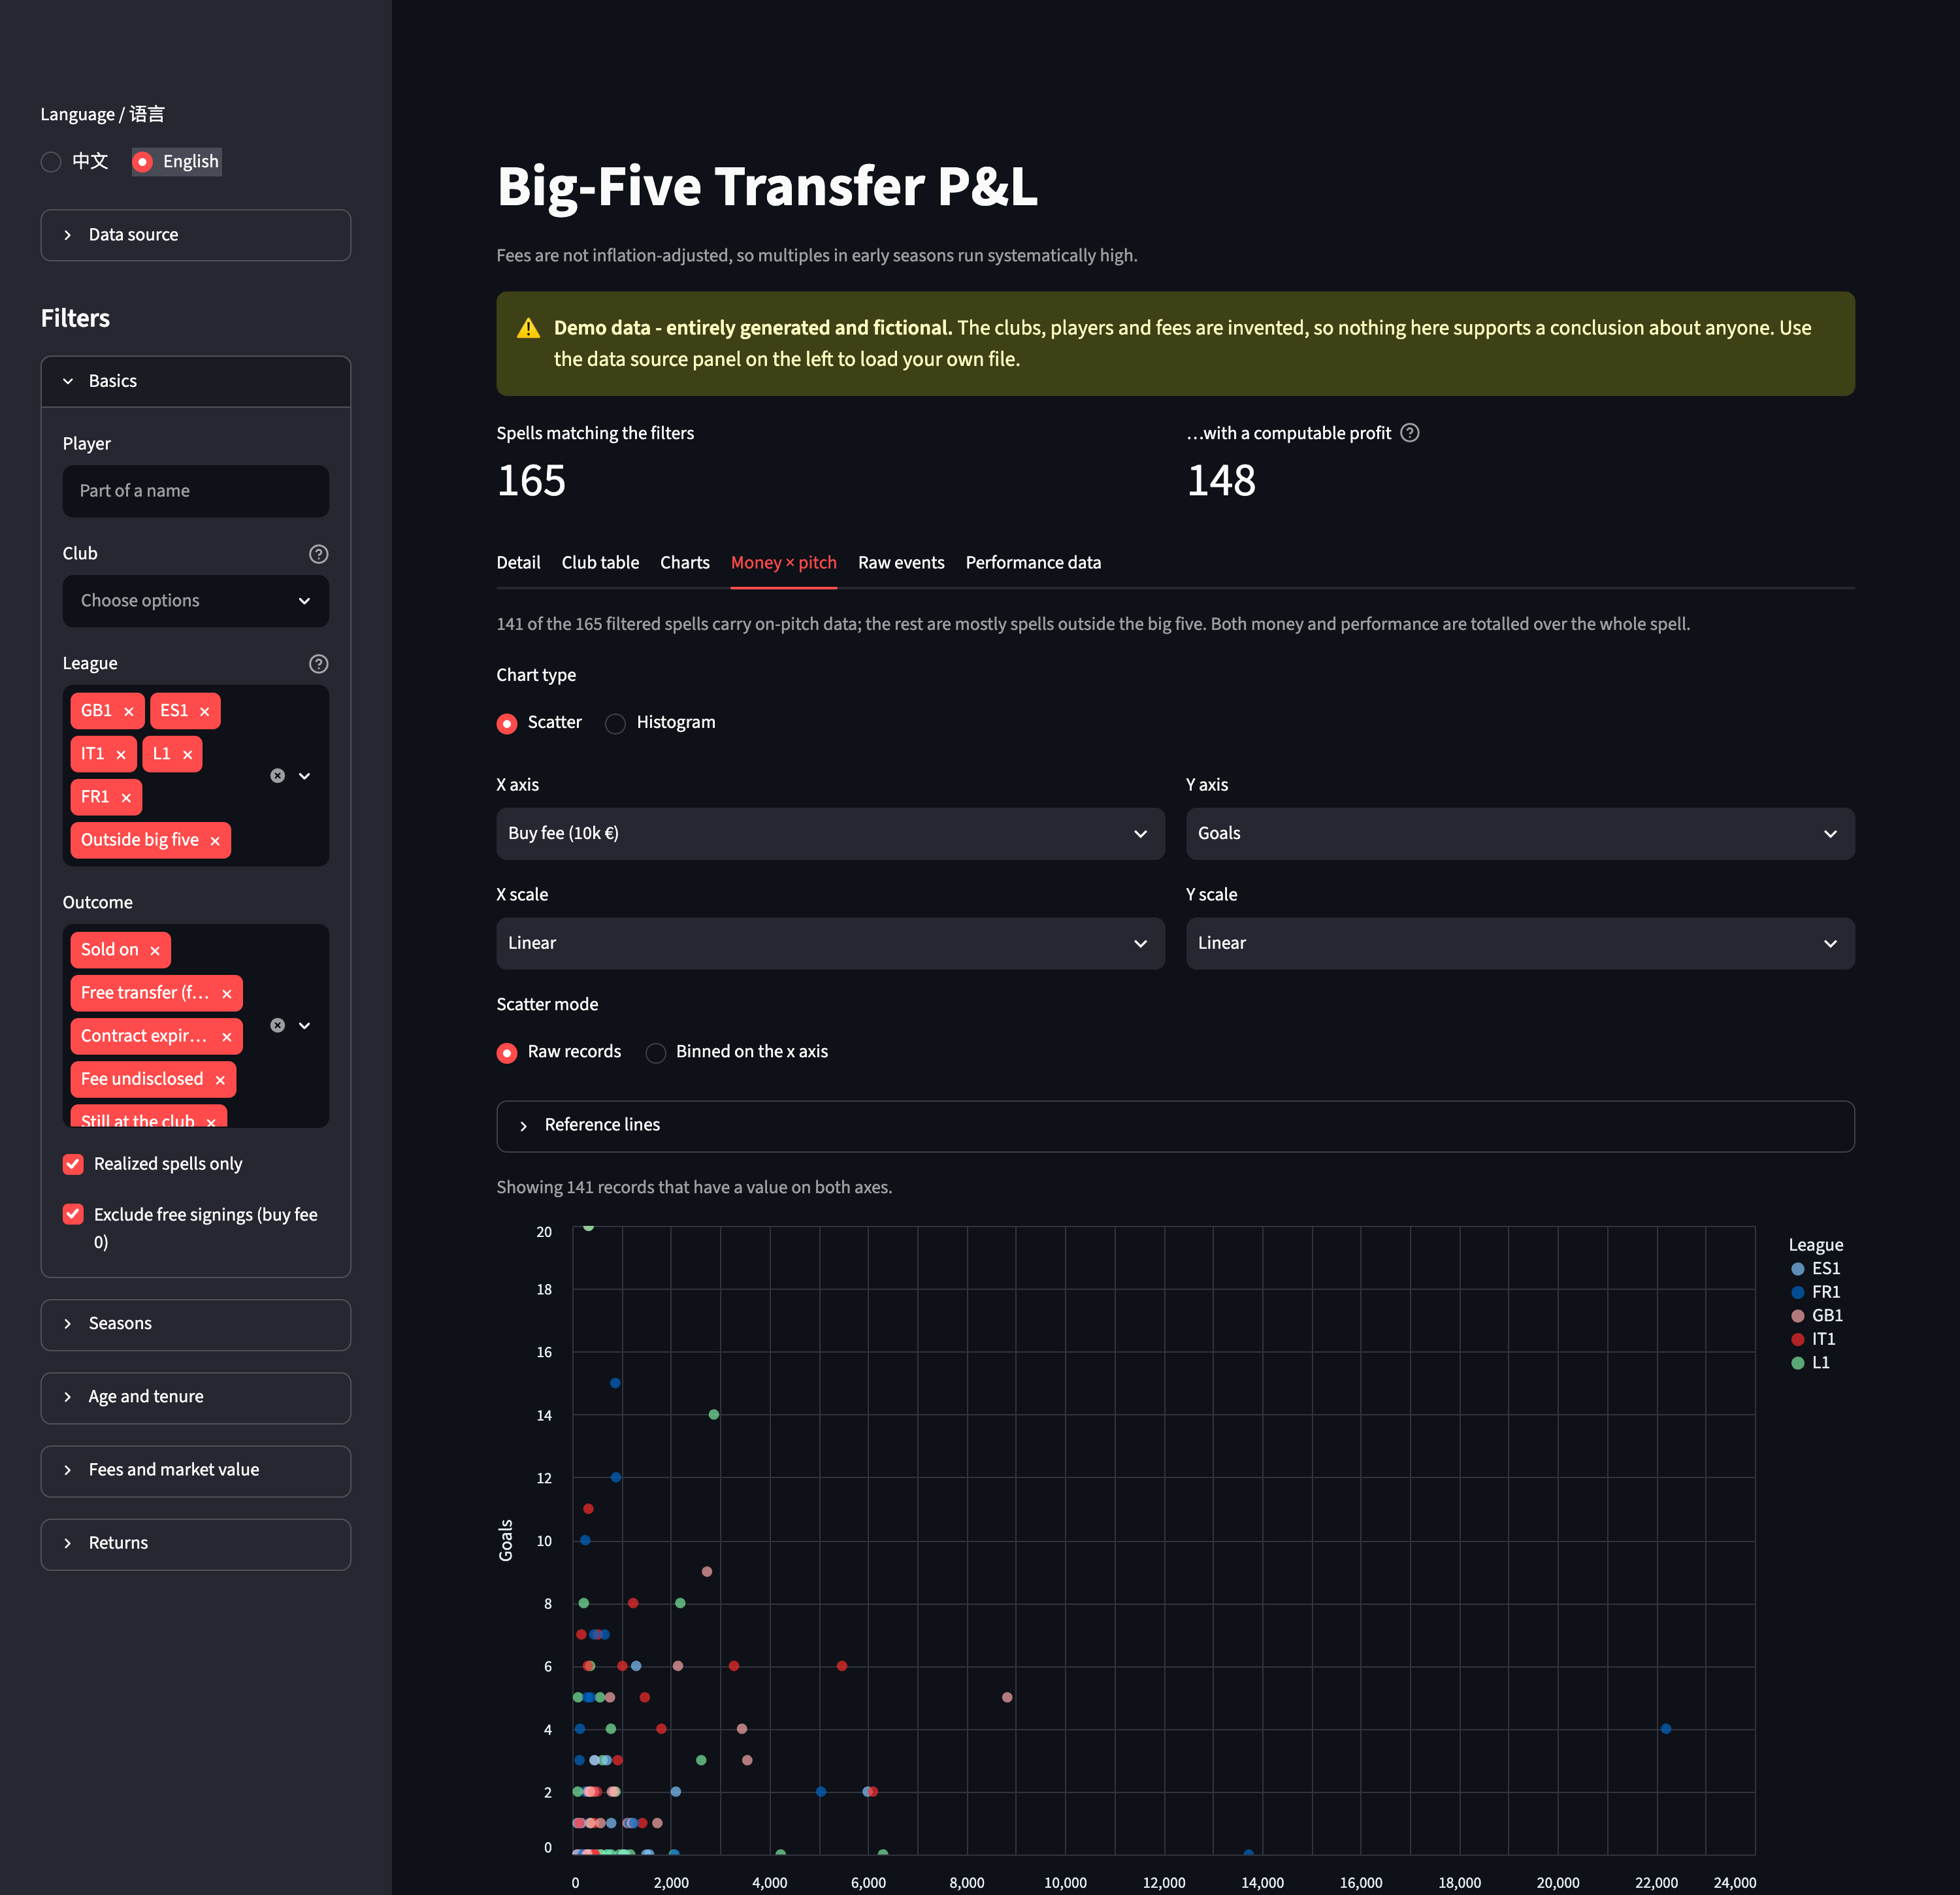
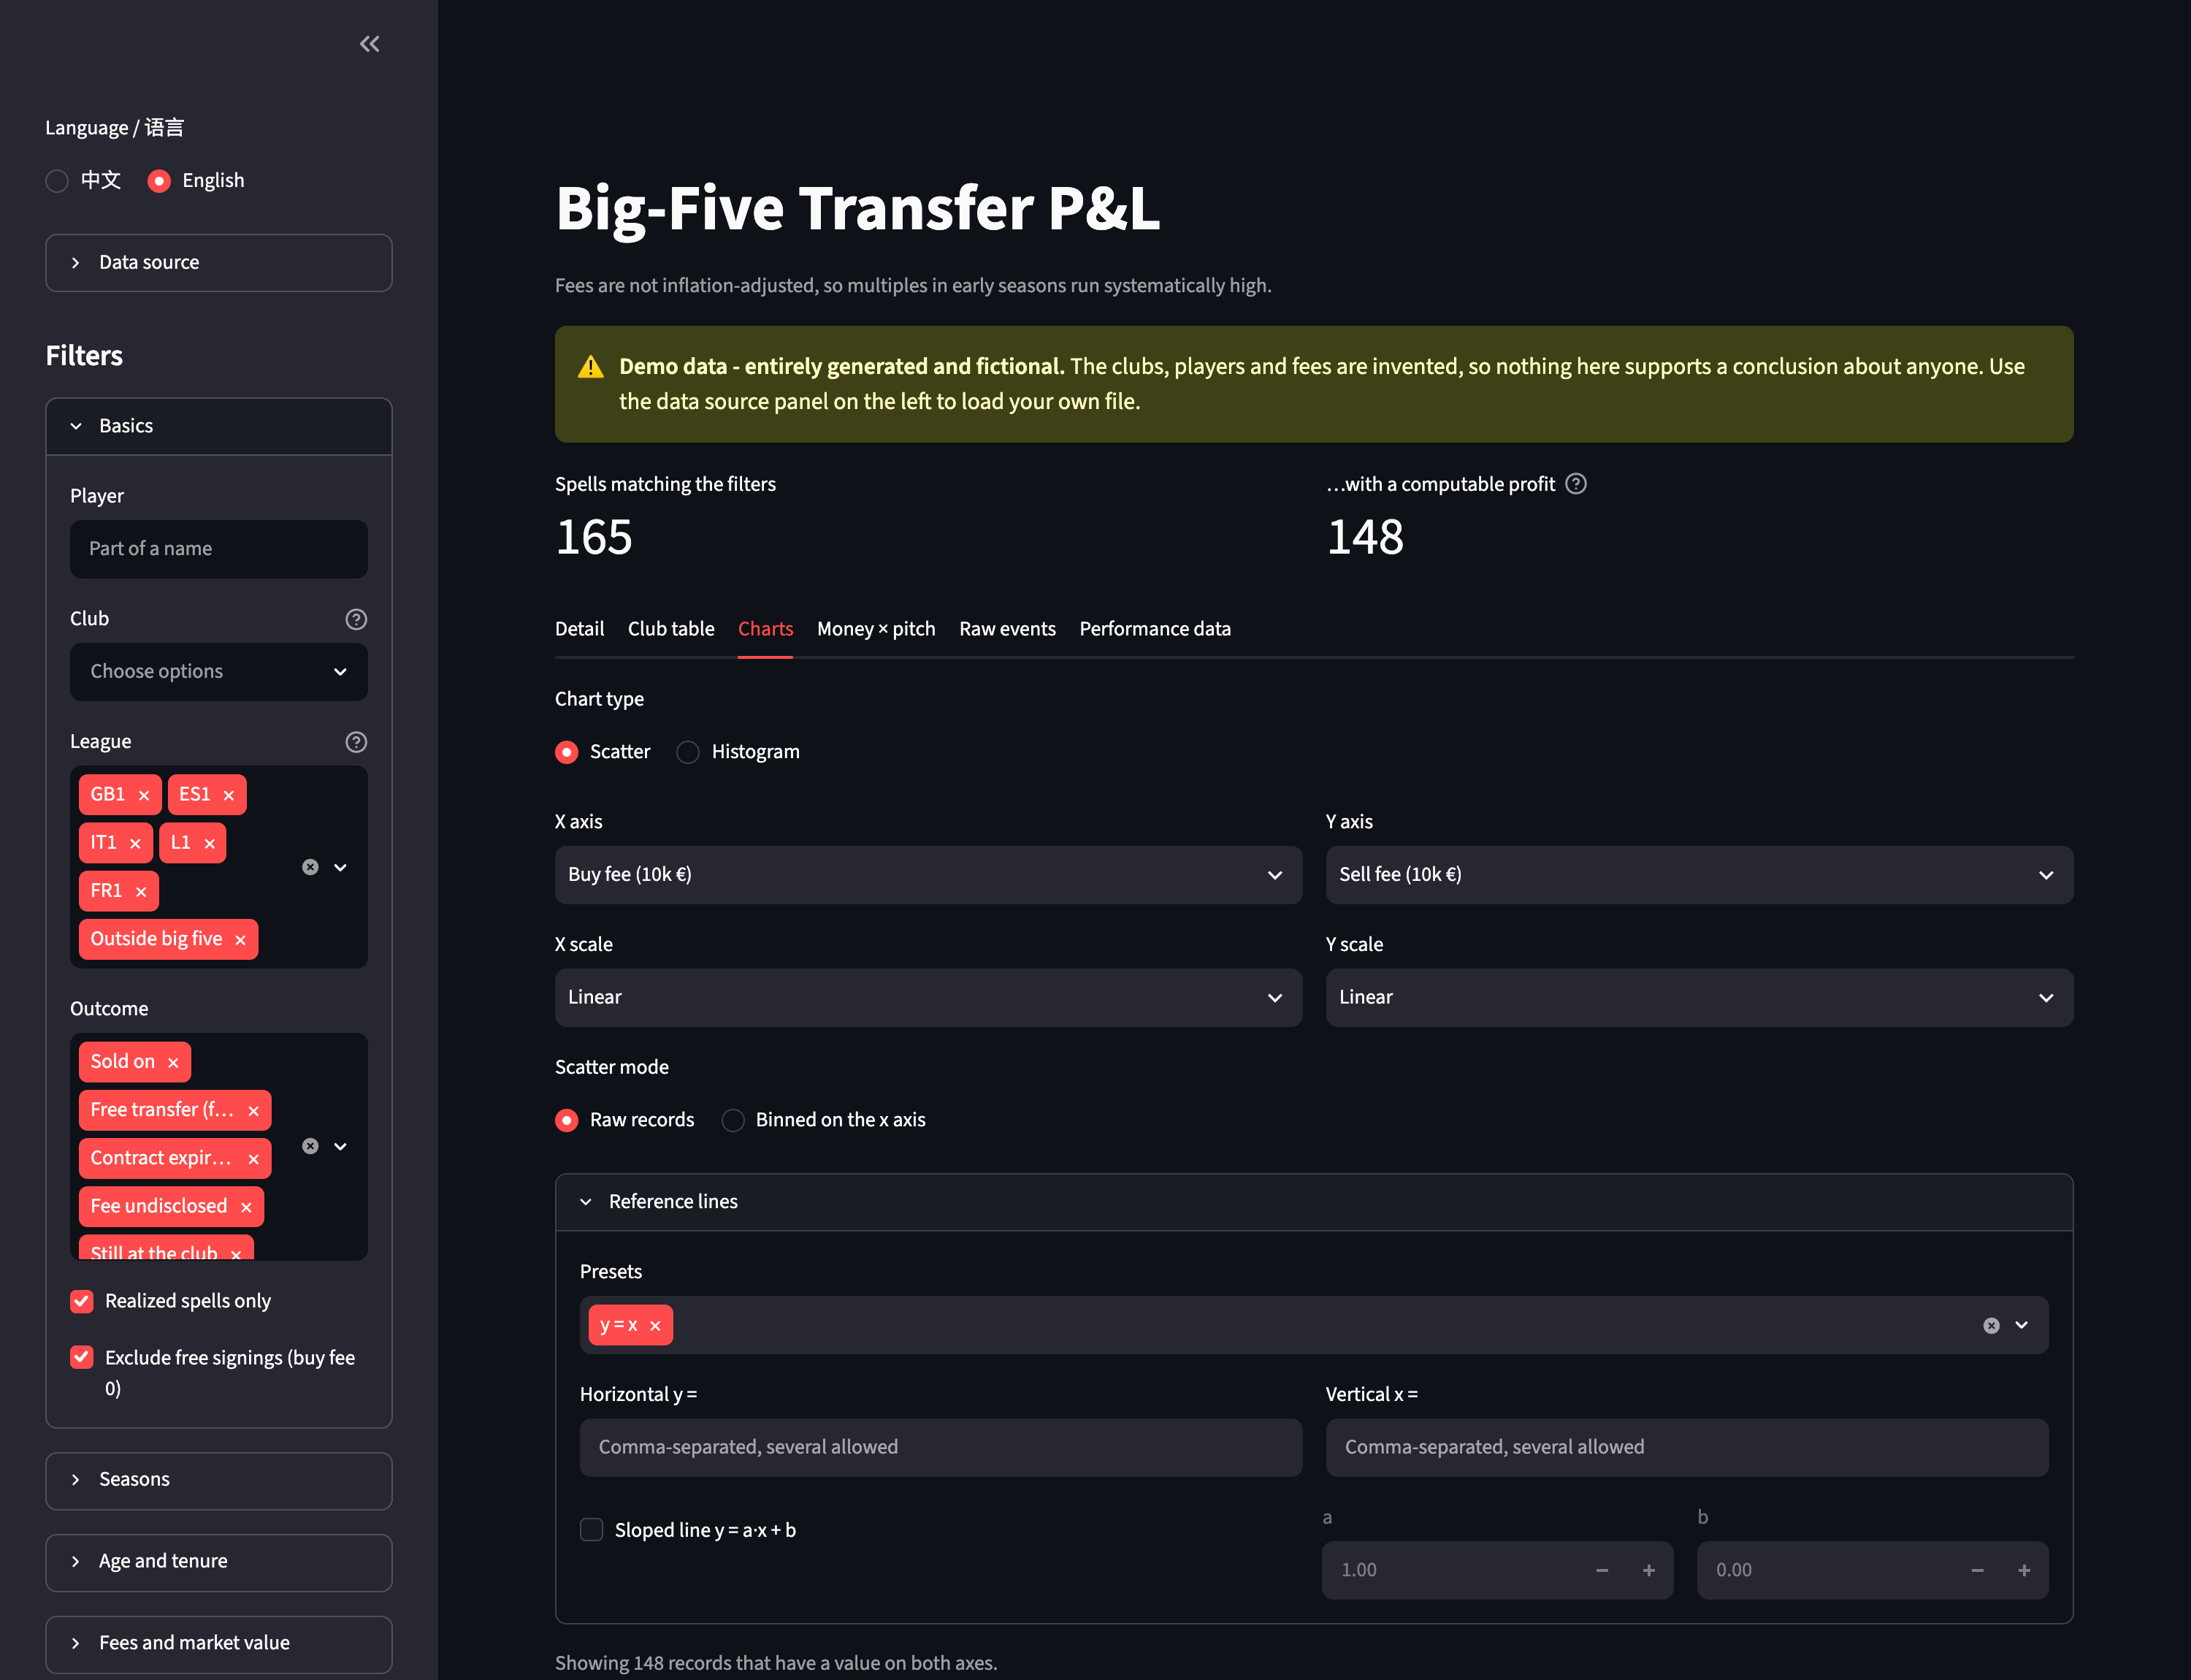
On the money side: fee in, fee out, profit, return multiple, and the gap between what was paid and what the player was valued at. On the pitch side: minutes, goals, assists, expected goals, progressive passes and carries, tackles, distance covered. Plot any of it against any of it, on linear, log or symlog scales, as raw points or binned with error bars.
What the data actually says
My own copy covers the big five, 2015/16 to 2024/25, loans excluded — 22,063 spells. Some of what falls out of it was not what I expected.
Most deals lose money, and the bigger the fee the more reliably. Among realized spells with a fee actually paid, 61.8% ended below what was paid for them. Split by fee band, the pattern is monotonic:
| Fee paid | Spells | Median profit | Share that lost money |
|---|---|---|---|
| under €1m | 445 | −€0.1m | 55.7% |
| €1–5m | 1,110 | −€0.8m | 58.8% |
| €5–10m | 542 | −€2.2m | 60.3% |
| €10–20m | 474 | −€5.5m | 65.4% |
| €20–40m | 256 | −€15.0m | 75.4% |
| €40–80m | 53 | −€32.8m | 84.9% |
| over €80m | 13 | −€98.0m | 100% |
Two caveats before anyone quotes that last row. It is thirteen deals. And fees are not inflation-adjusted here, so a 2016 purchase resold in 2023 is measured against a market that moved underneath it.
A third caveat matters more, and it cuts both ways: this only counts players who were actually sold. Across every fee band, roughly half the purchases have no sale yet — 45% to 67% depending on the band — and they are excluded entirely. Whether that flatters the numbers or damns them depends on which players a club chose to keep, which is exactly what the table cannot tell you.
Money buys goals, but weakly. Log fee against goals, among players with more than 900 minutes in the spell, correlates at 0.27. It is real and it is not much. The scatter is a cloud with a slope, not a line.
Two in five spells have no purchase side at all. 41.5% of rows have no recorded arrival: academy graduates, or players who were already at the club before the seasons I cover. There is a departure to judge and nothing to judge it against.
The blank cell is the whole problem
That last figure is where I made my most instructive mistake.
buy_fee is null in 46% of rows, and for a while I read that as “46% of fees
are undisclosed”. It is not. Those nulls are two entirely different things:
- No arrival recorded — 41.5% of all rows. The purchase happened outside the data, or never happened.
- Arrival recorded, fee never published — only 8.2% of the spells that do have an arrival.
Conflating them is a fivefold error, and it propagated: it was baked into the demo dataset, which then told visitors that nearly half of all recorded signings had a secret fee. They do not.
There is a third state hiding in the same column, and it is the one most likely to break an analysis:
- A fee of exactly zero is a free transfer — a price that was paid. 39% of recorded arrivals are free signings.
- A blank is a price nobody published.
Read a blank as zero and every derived figure downstream is wrong: the profit, the return multiple, the cost per goal, and any average that includes them. The app keeps the three states distinct and leaves everything derived from a missing fee null rather than guessing. Likewise, a player still at the club is not a failed signing — there is no sale, so there is no return, and the tool will not invent a paper valuation to fill the gap.
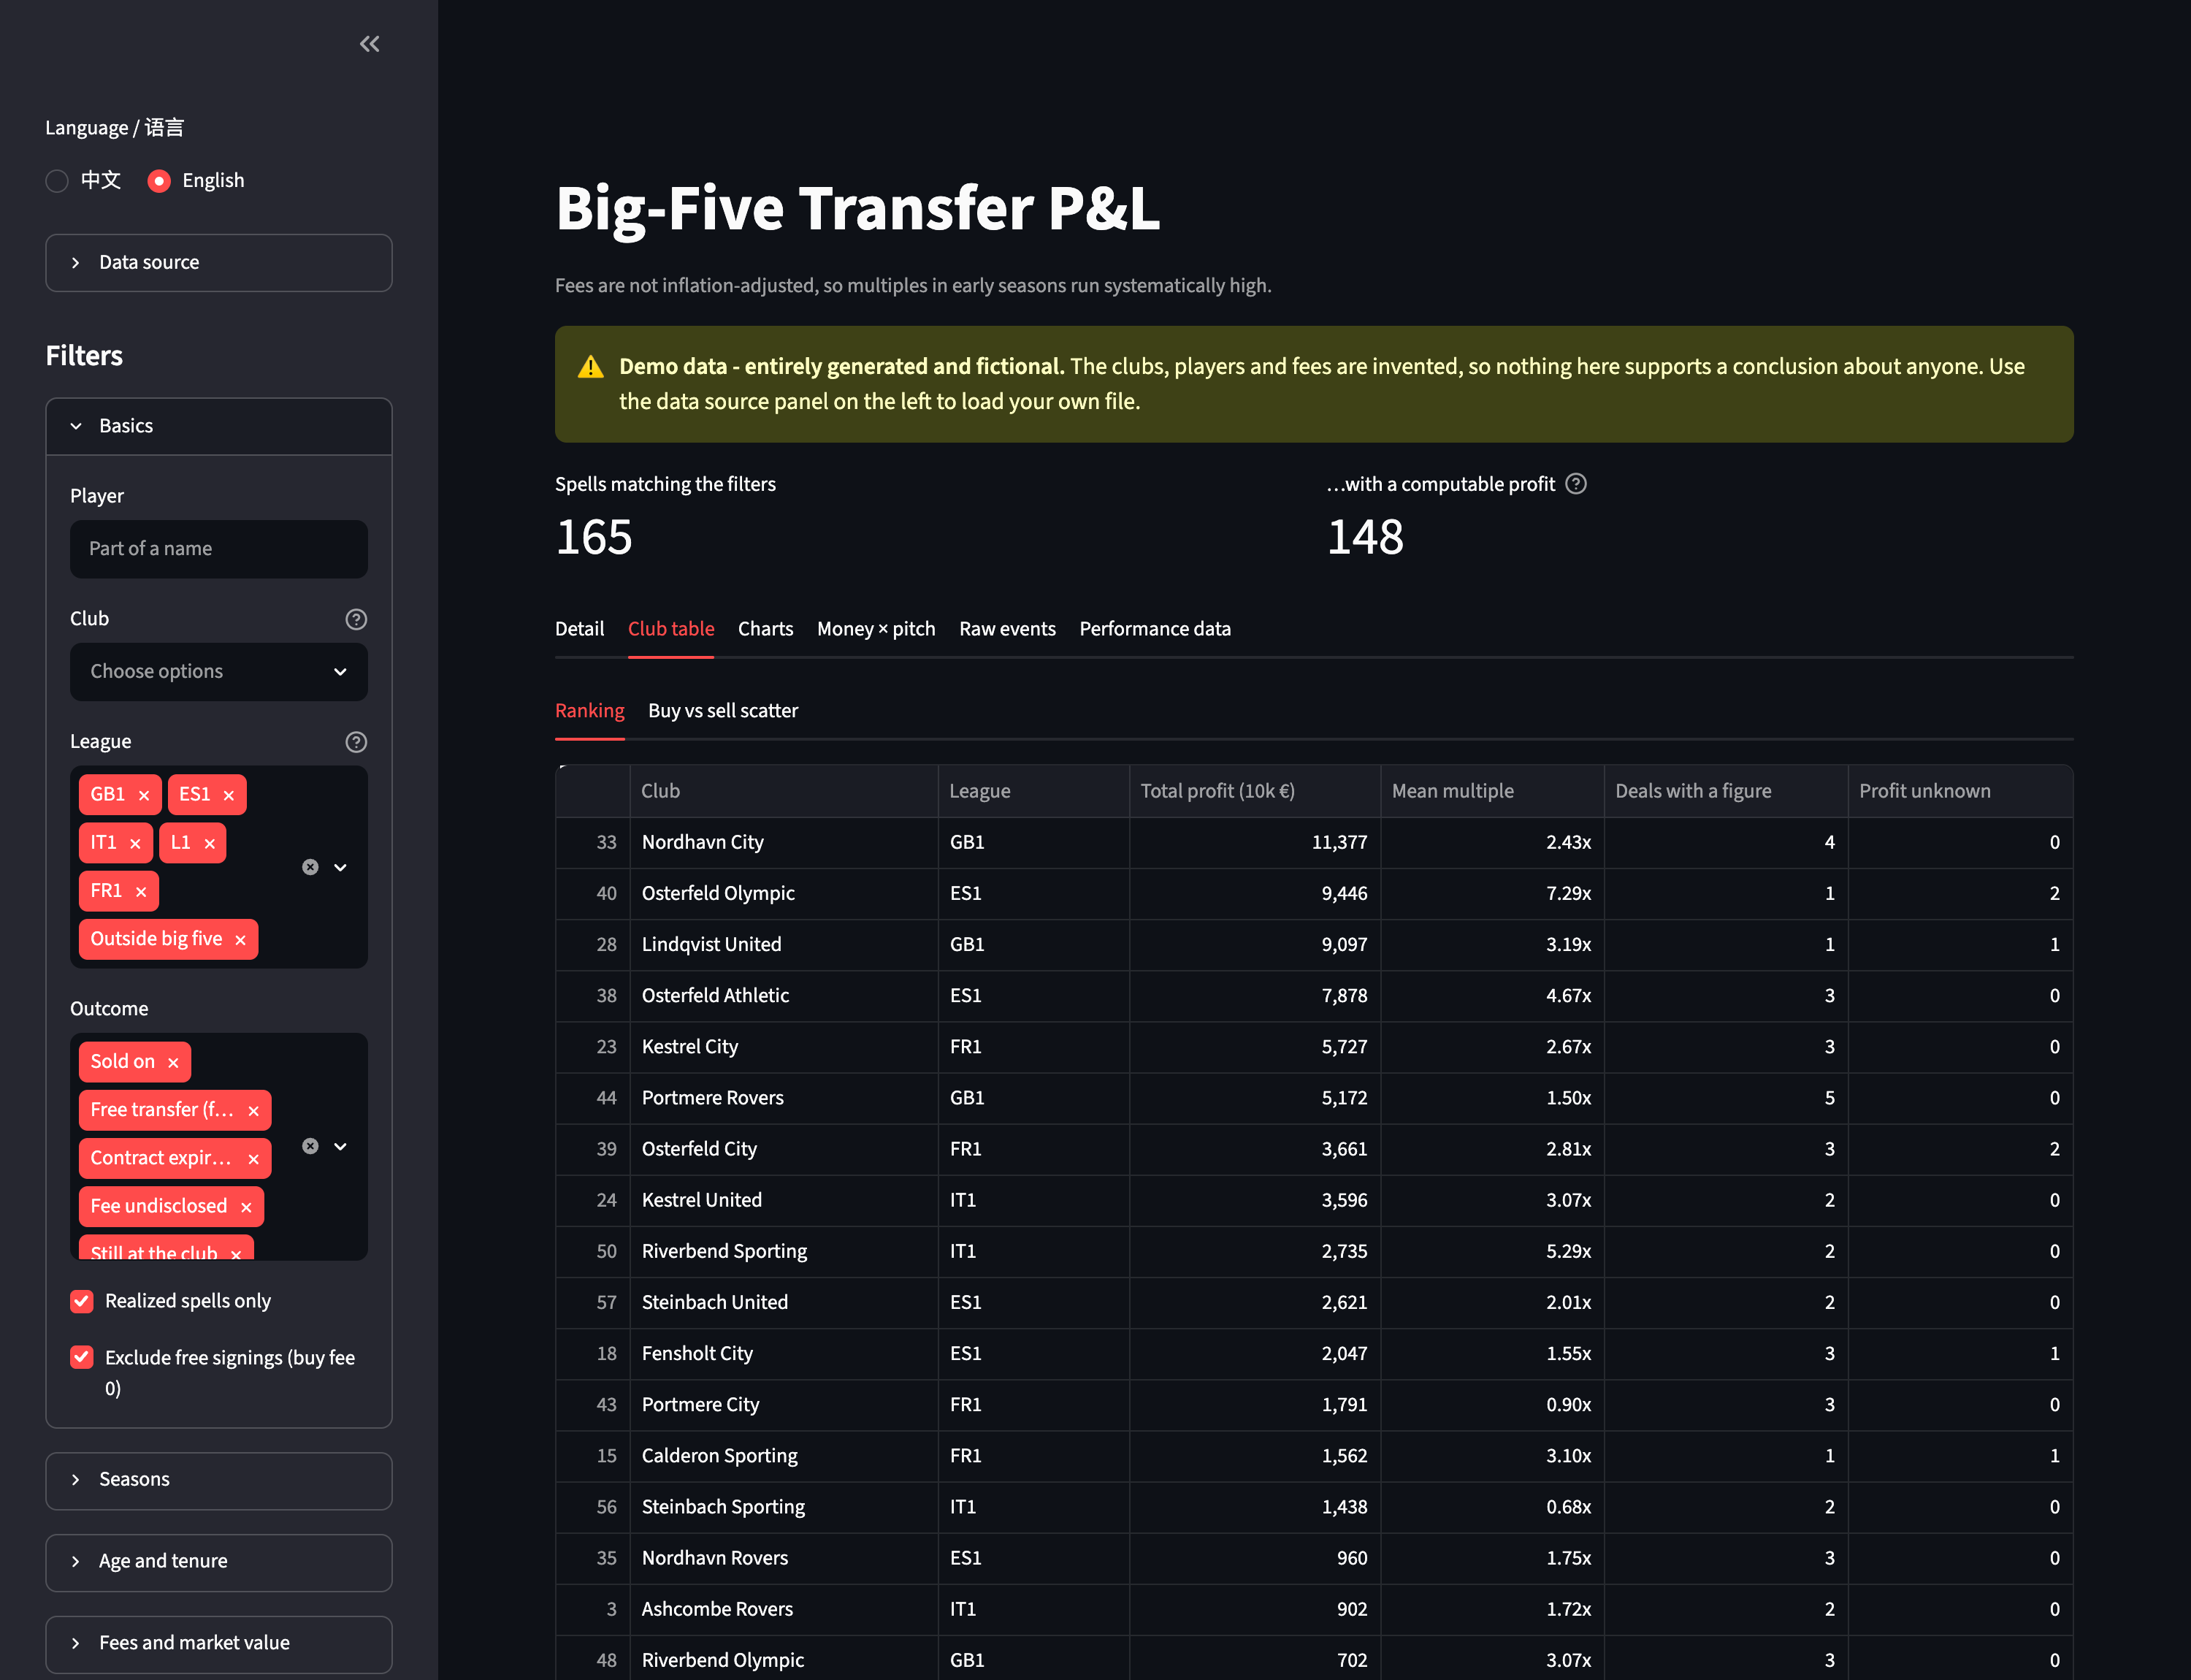
Note the last column in that table. “Profit unknown” is not a rounding error to be swept up — for most clubs it is a meaningful share of their dealings, and a league table that quietly dropped those rows would rank clubs on the subset of deals that happened to be public.
Why the page carries no data
The tool is online and free. The dataset is not, and cannot be.
Transfermarkt’s terms require prior written consent before their content is
included in an online service “even in part”, and separately assert database
rights over the collection. The EU’s sui generis database right protects
substantial extraction independently of copyright — an individual fee is a fact,
but systematically lifting a database is not. The other sources I use say the
same thing in different words: the Bundesliga’s own site permits personal,
private, non-commercial copies only, and worldfootballR_data carries no licence
at all, which means all rights reserved rather than free to use.
So the published page ships software only. It runs entirely in the reader’s browser — Streamlit compiled to WebAssembly via stlite, one static HTML file, no server anywhere — and the reader supplies their own file, which is parsed locally and never uploaded.
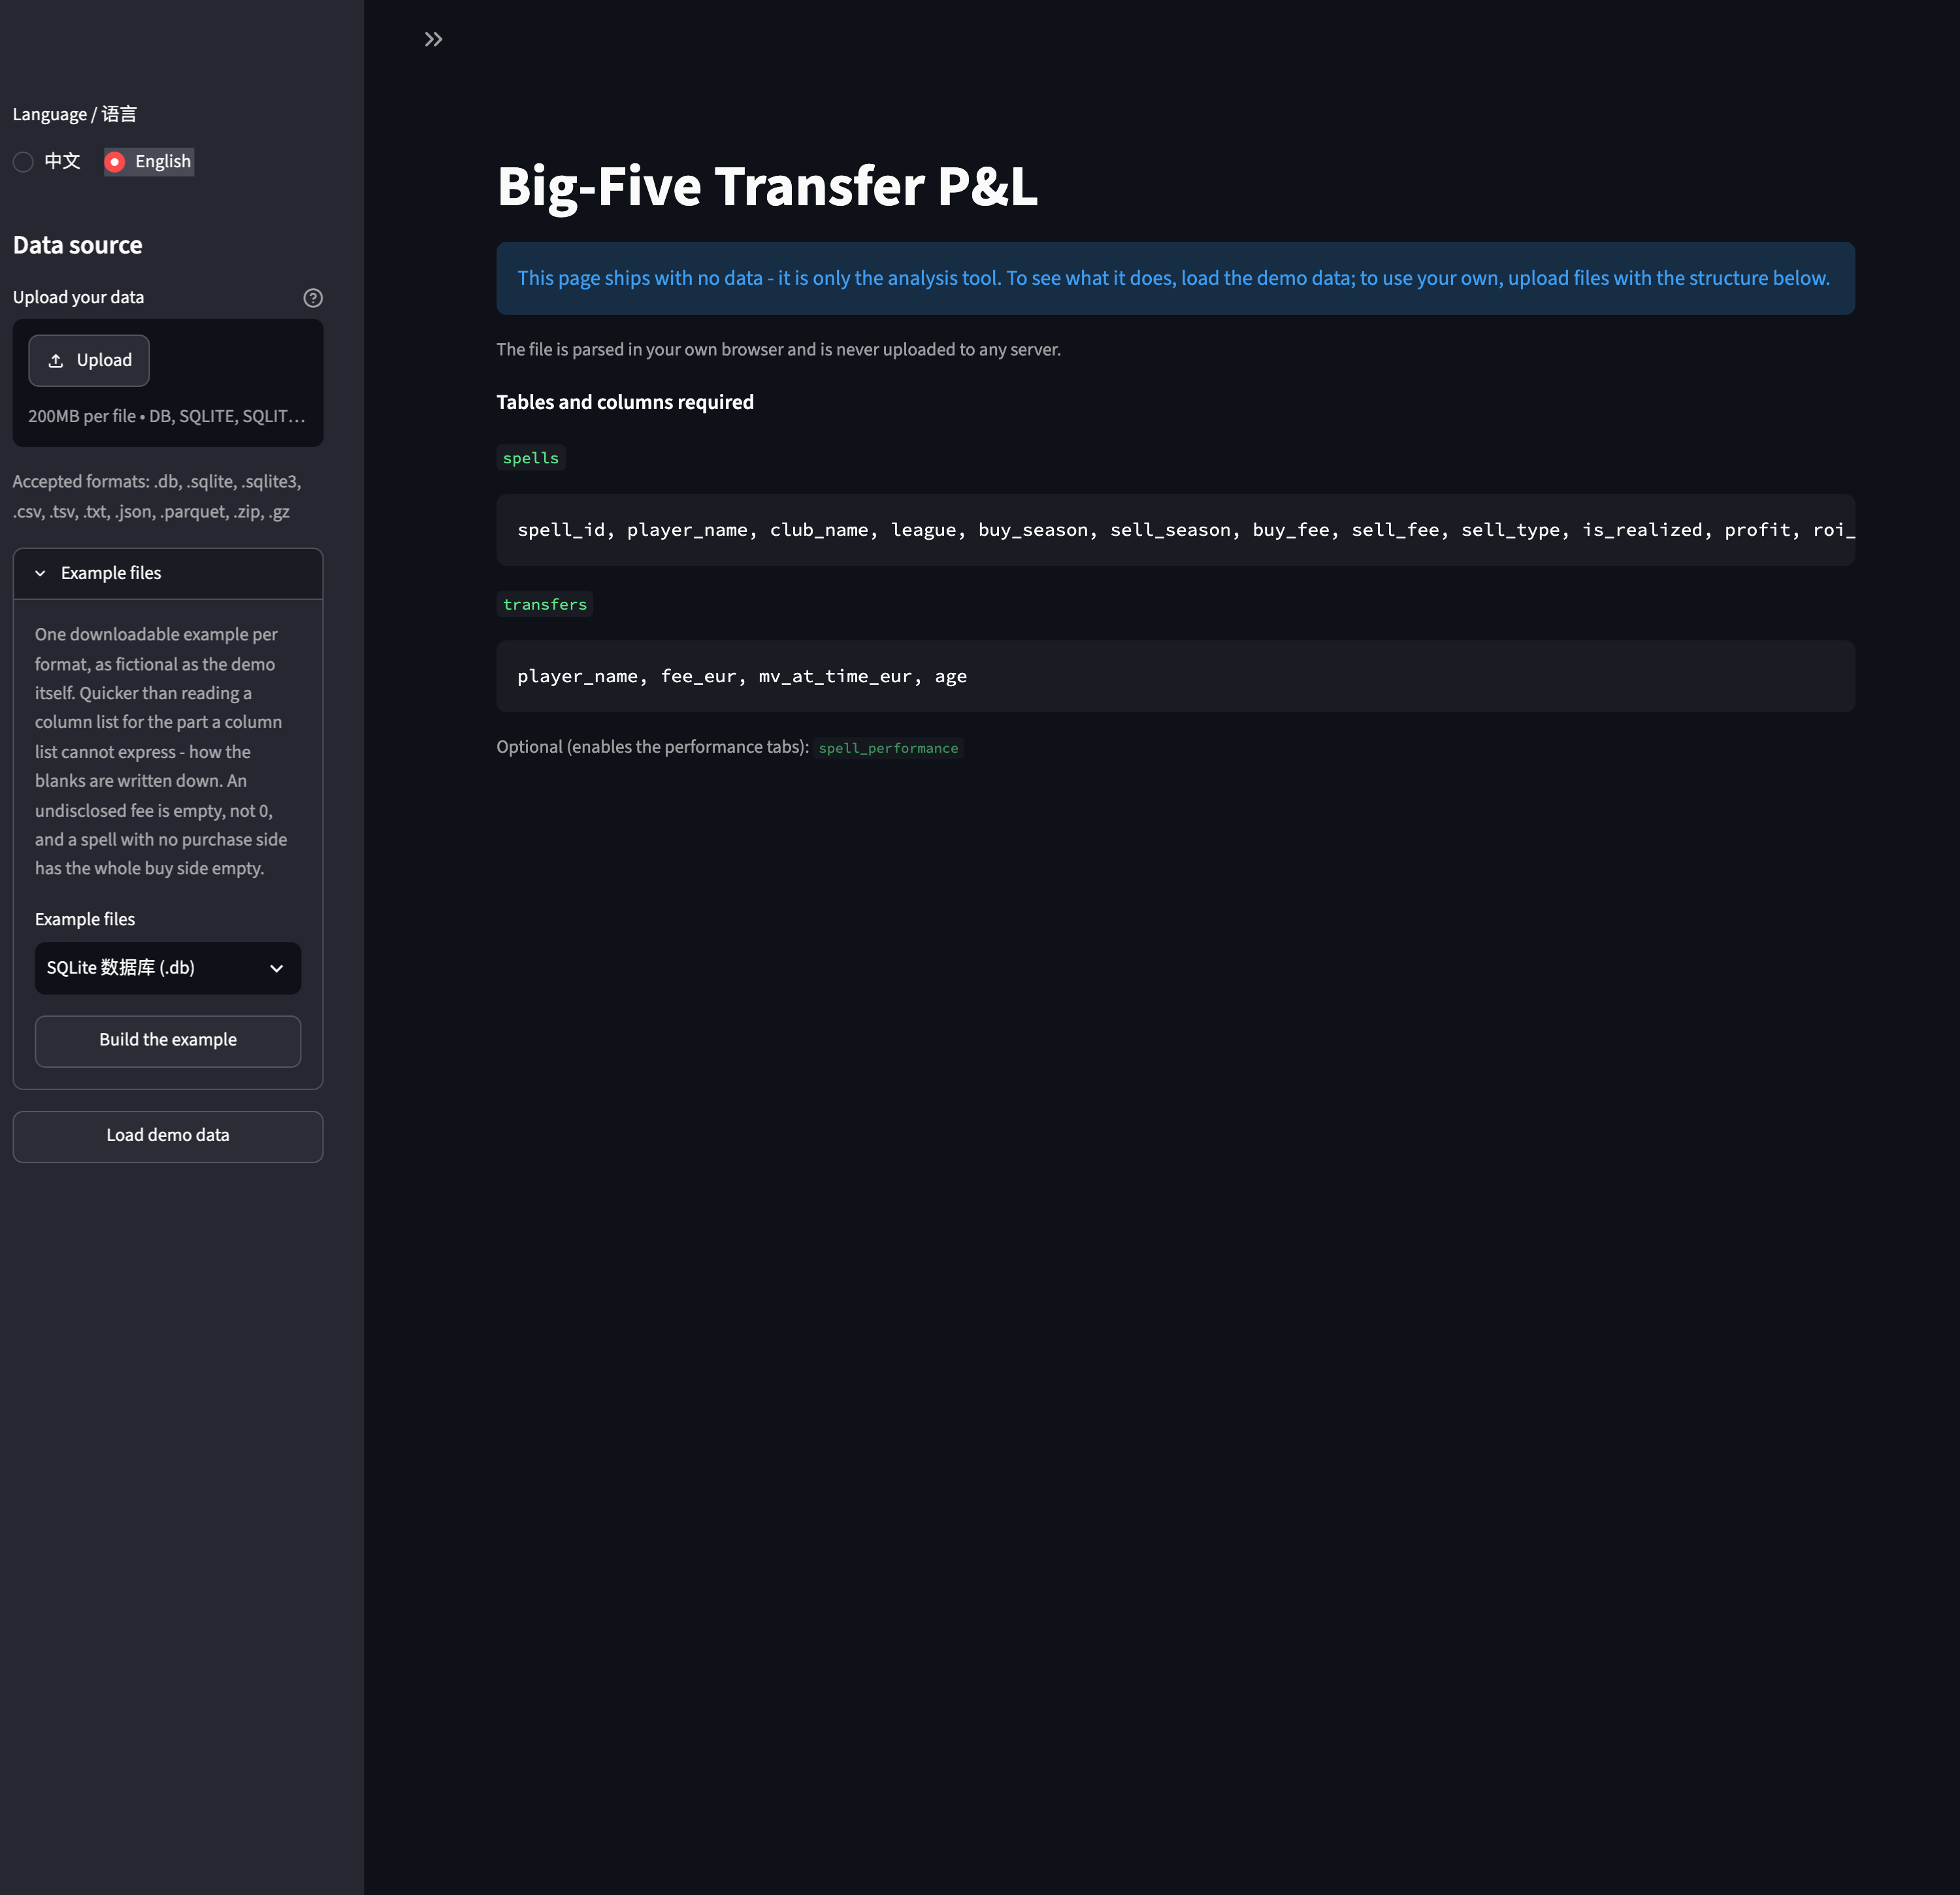
A database, one CSV per table, a zip of those, JSON, or Parquet. Delimiters are
sniffed, so a semicolon-separated European Excel export opens correctly and a
UTF-8 byte order mark gets stripped instead of becoming part of the first
column’s name. Headers are matched loosely — Player Name, player_name and
player all land in the same place. Files with unhelpful names are routed by
their columns, so export (3).csv still works. And there is a downloadable
worked example in every format, because a column list is a specification and a
file you can open is an answer.
The demo is invented, and its distributions are not
Which leaves the question of what a visitor sees with no file. Shipping a small extract of real rows is precisely what “even in part” covers, so the page generates a demo instead: invented clubs, invented players, fees drawn from a distribution. It ships as Python source and runs in the browser, which keeps “this page contains no data” literally true.
But making up the distributions too would teach a market that does not exist. So around forty aggregate moments — medians, quartile spreads, proportions, one correlation — are measured against the real database and written in as constants. The rows are fiction; the shape is not. You cannot reconstruct a transfer from a standard deviation, and 22,000 rows reduced to forty numbers is itself the argument for why that is analysis rather than extraction.
It also reproduces the gaps rather than papering over them: undisclosed fees stay blank, unsold players have no sale, expected goals start late, and running distance covers only part of the data. A tidy demo where every cell is populated would misrepresent the one thing that actually makes this data hard.
Known limitations
- No inflation adjustment. Early-season multiples run systematically high.
- Loans excluded entirely.
- Unsold players carry no paper valuation, so about half of all purchases have no computable return.
- Expected goals start in 2017/18 in my copy, because upstream has nothing earlier. Running distance exists for one league from 2019/20. Both are properties of my sources, not of the tool — the app reports coverage from whatever file you load rather than asserting it.
Links
- Try it: https://littlecaps.github.io/scout/?demo=1 — opens straight into the demo
- Code: https://github.com/LittleCaps/scout-app — MIT, page-side source; the crawler and pipeline stay private for the reasons above
- Alongside Pass Advisor on the tools page
One closing note for anyone building something similar. Every test I had passed
while the published page was completely broken: Pyodide unvendors sqlite3 from
the standard library, so a module-level import sqlite3 anywhere in the bundle
killed the page on load — and only in the browser, never on my laptop. The fix
was easy. The lesson was that the constraint needed reproducing locally, so
there is now a test that strips the module out of __import__ and imports the
whole bundle without it.